$250/month ad spend.
7 months later: $3 CPA for
paying B2B SaaS customers.
A B2B SaaS business phone system spending $200-300/month on Facebook and Instagram. Three deliberate execution decisions turned that into a $3 cost-per-acquisition, roughly 15-50x below typical B2B benchmarks.
$250/month. Three decisions.
The client runs a B2B SaaS business phone system on a lean marketing budget. With $200-300/month allocated to paid social across Facebook and Instagram, the mandate was not to spend big. It was to spend smart. The challenge with B2B SaaS on social is audience intent: most people on Facebook and Instagram are not actively shopping for a business phone system. Getting the wrong clicks is costly. Getting the right clicks cheaply is the entire game.
Three execution decisions, made and refined over the June to December 2025 period, are directly responsible for the efficiency of this channel.
Tactic 1: Ad copy refresh.
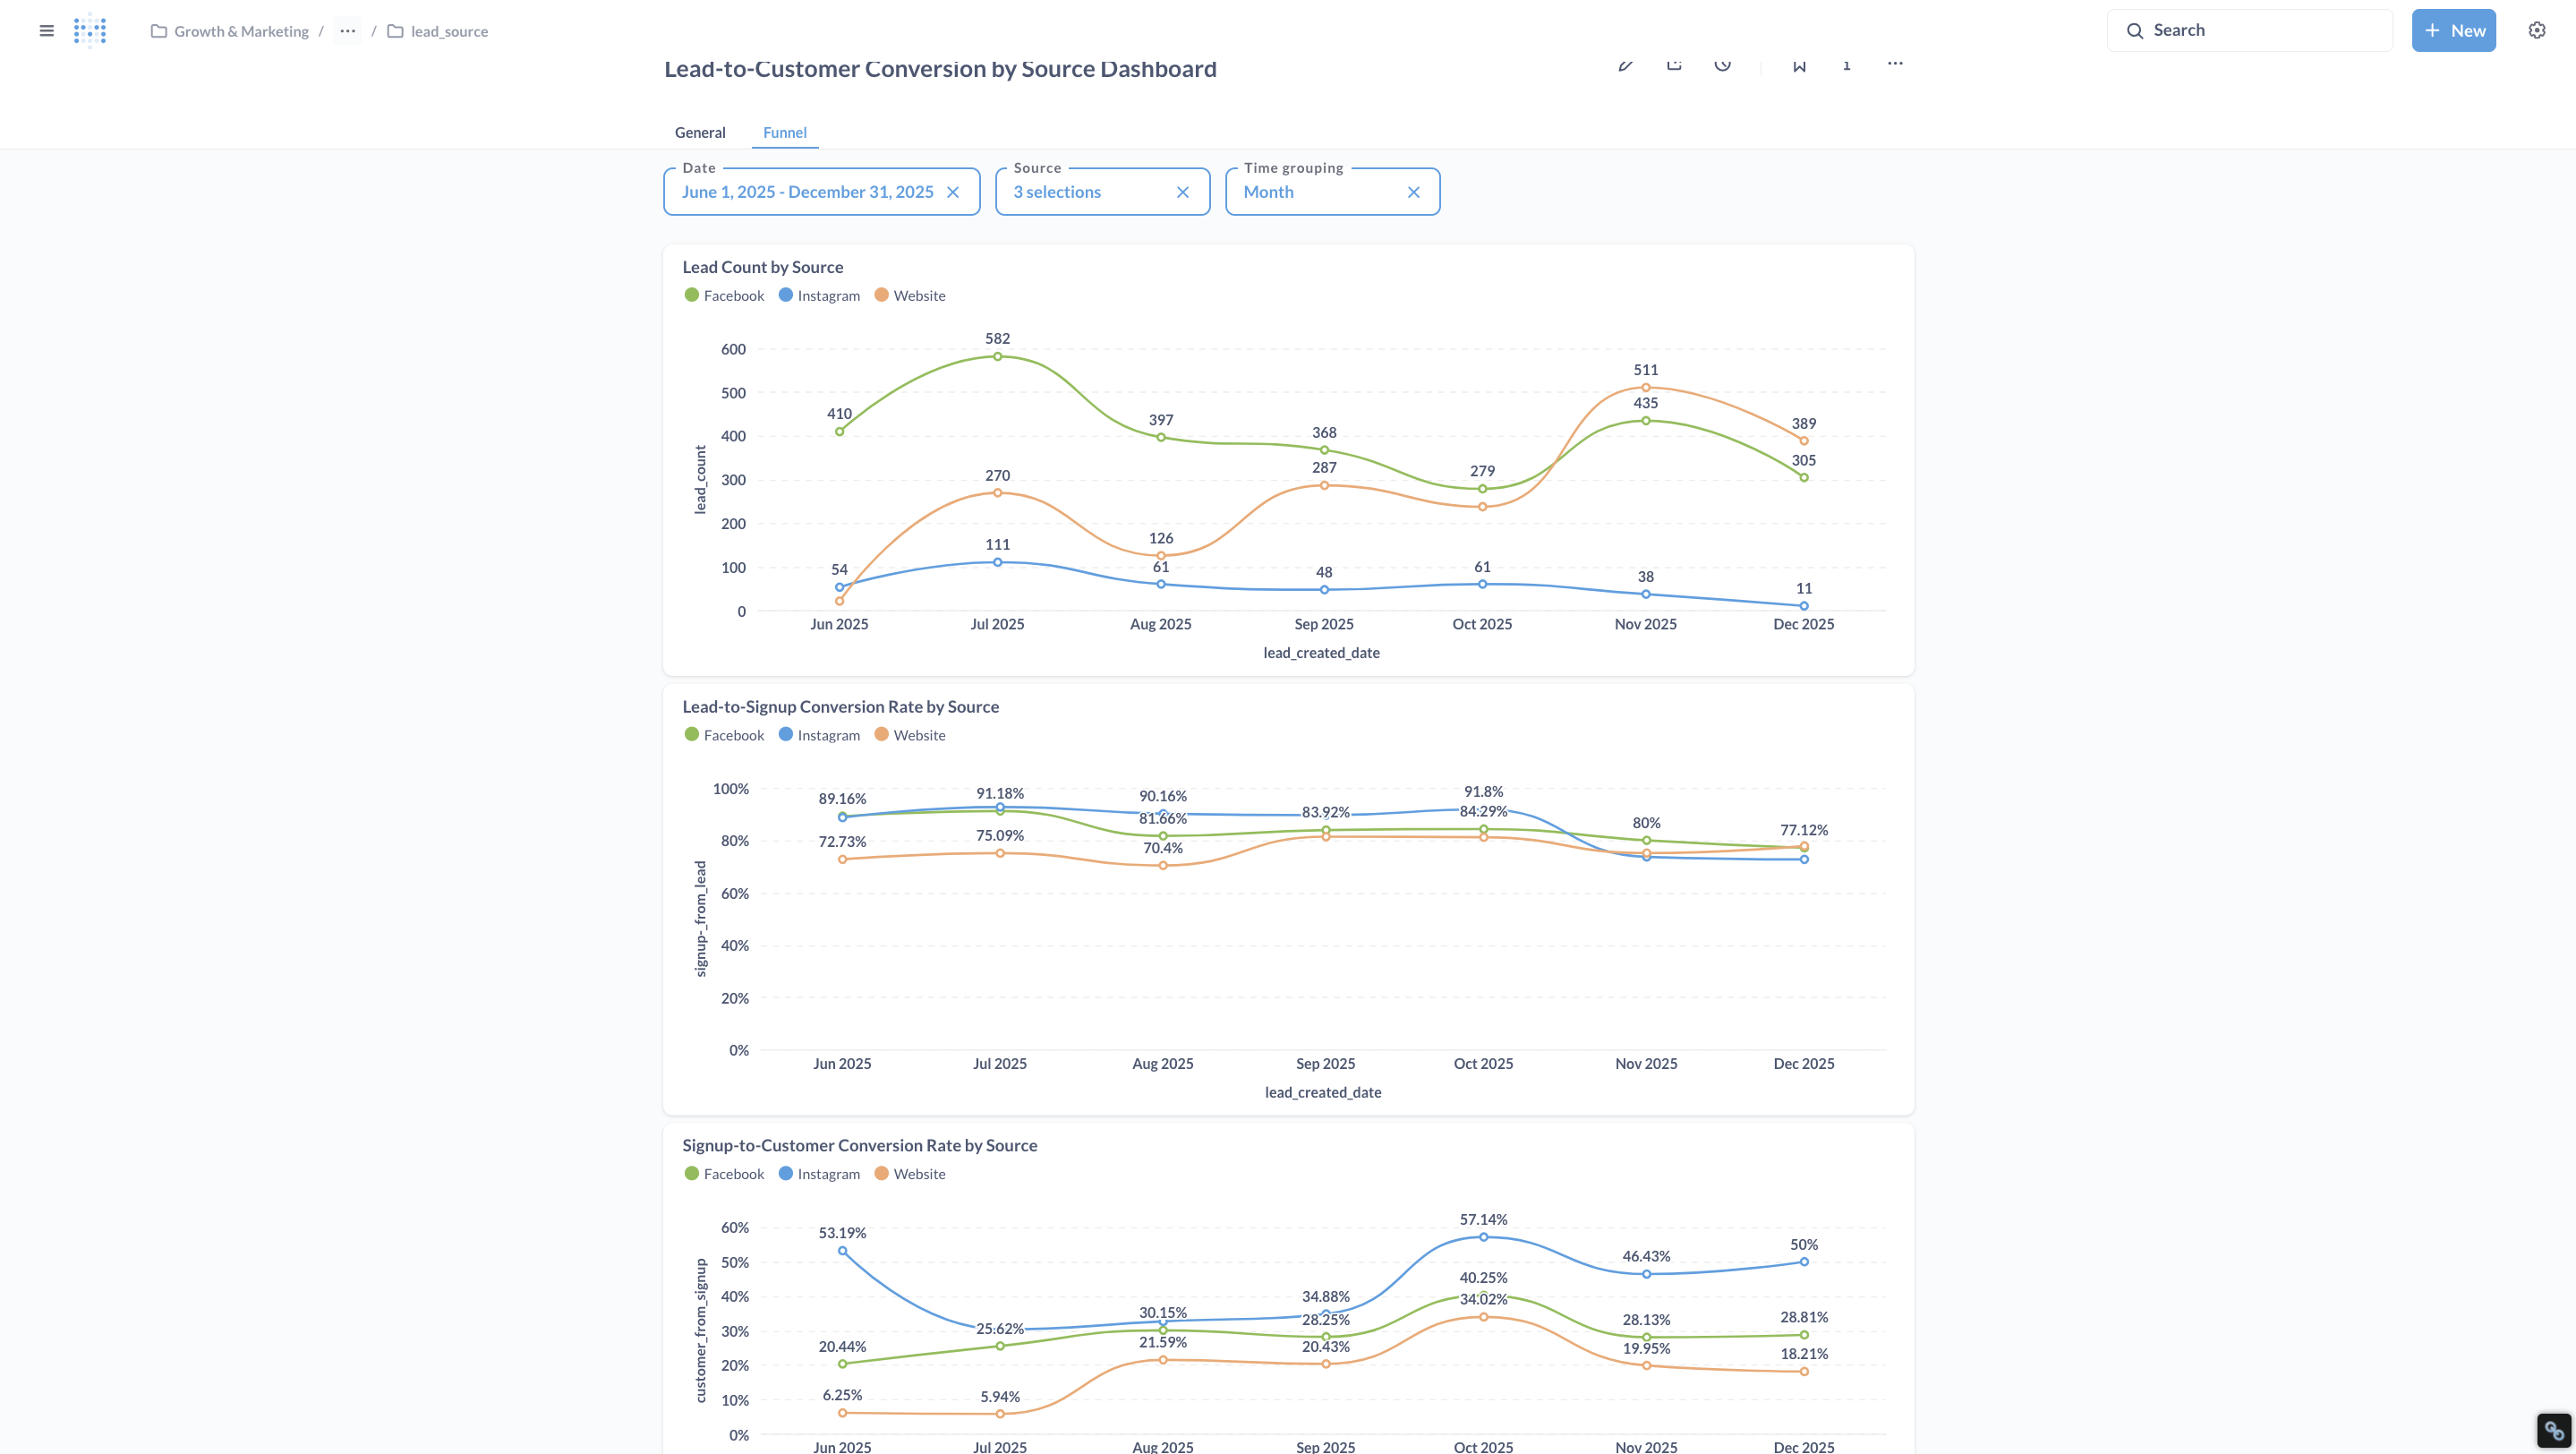
Periodically rewrote ad creatives to prevent audience fatigue, the gradual decline in performance as the same audience sees the same ad repeatedly. Facebook lead volume remained relatively stable across the period (410 in June, 435 in November) despite running a paid channel that typically decays without active management. Consistent volume equals sustained engagement.
Tactic 2: Peak-time budget allocation.
Ran data analysis to identify the hours and days when the target audience (Nigerian SMB owners and ops leads) were most active and most likely to convert. Shifted budget weight toward those windows. Same spend, better-timed delivery equals higher conversion probability per dollar. This is a direct driver of CPA efficiency without requiring additional budget.
Tactic 3: Upfront pricing transparency.
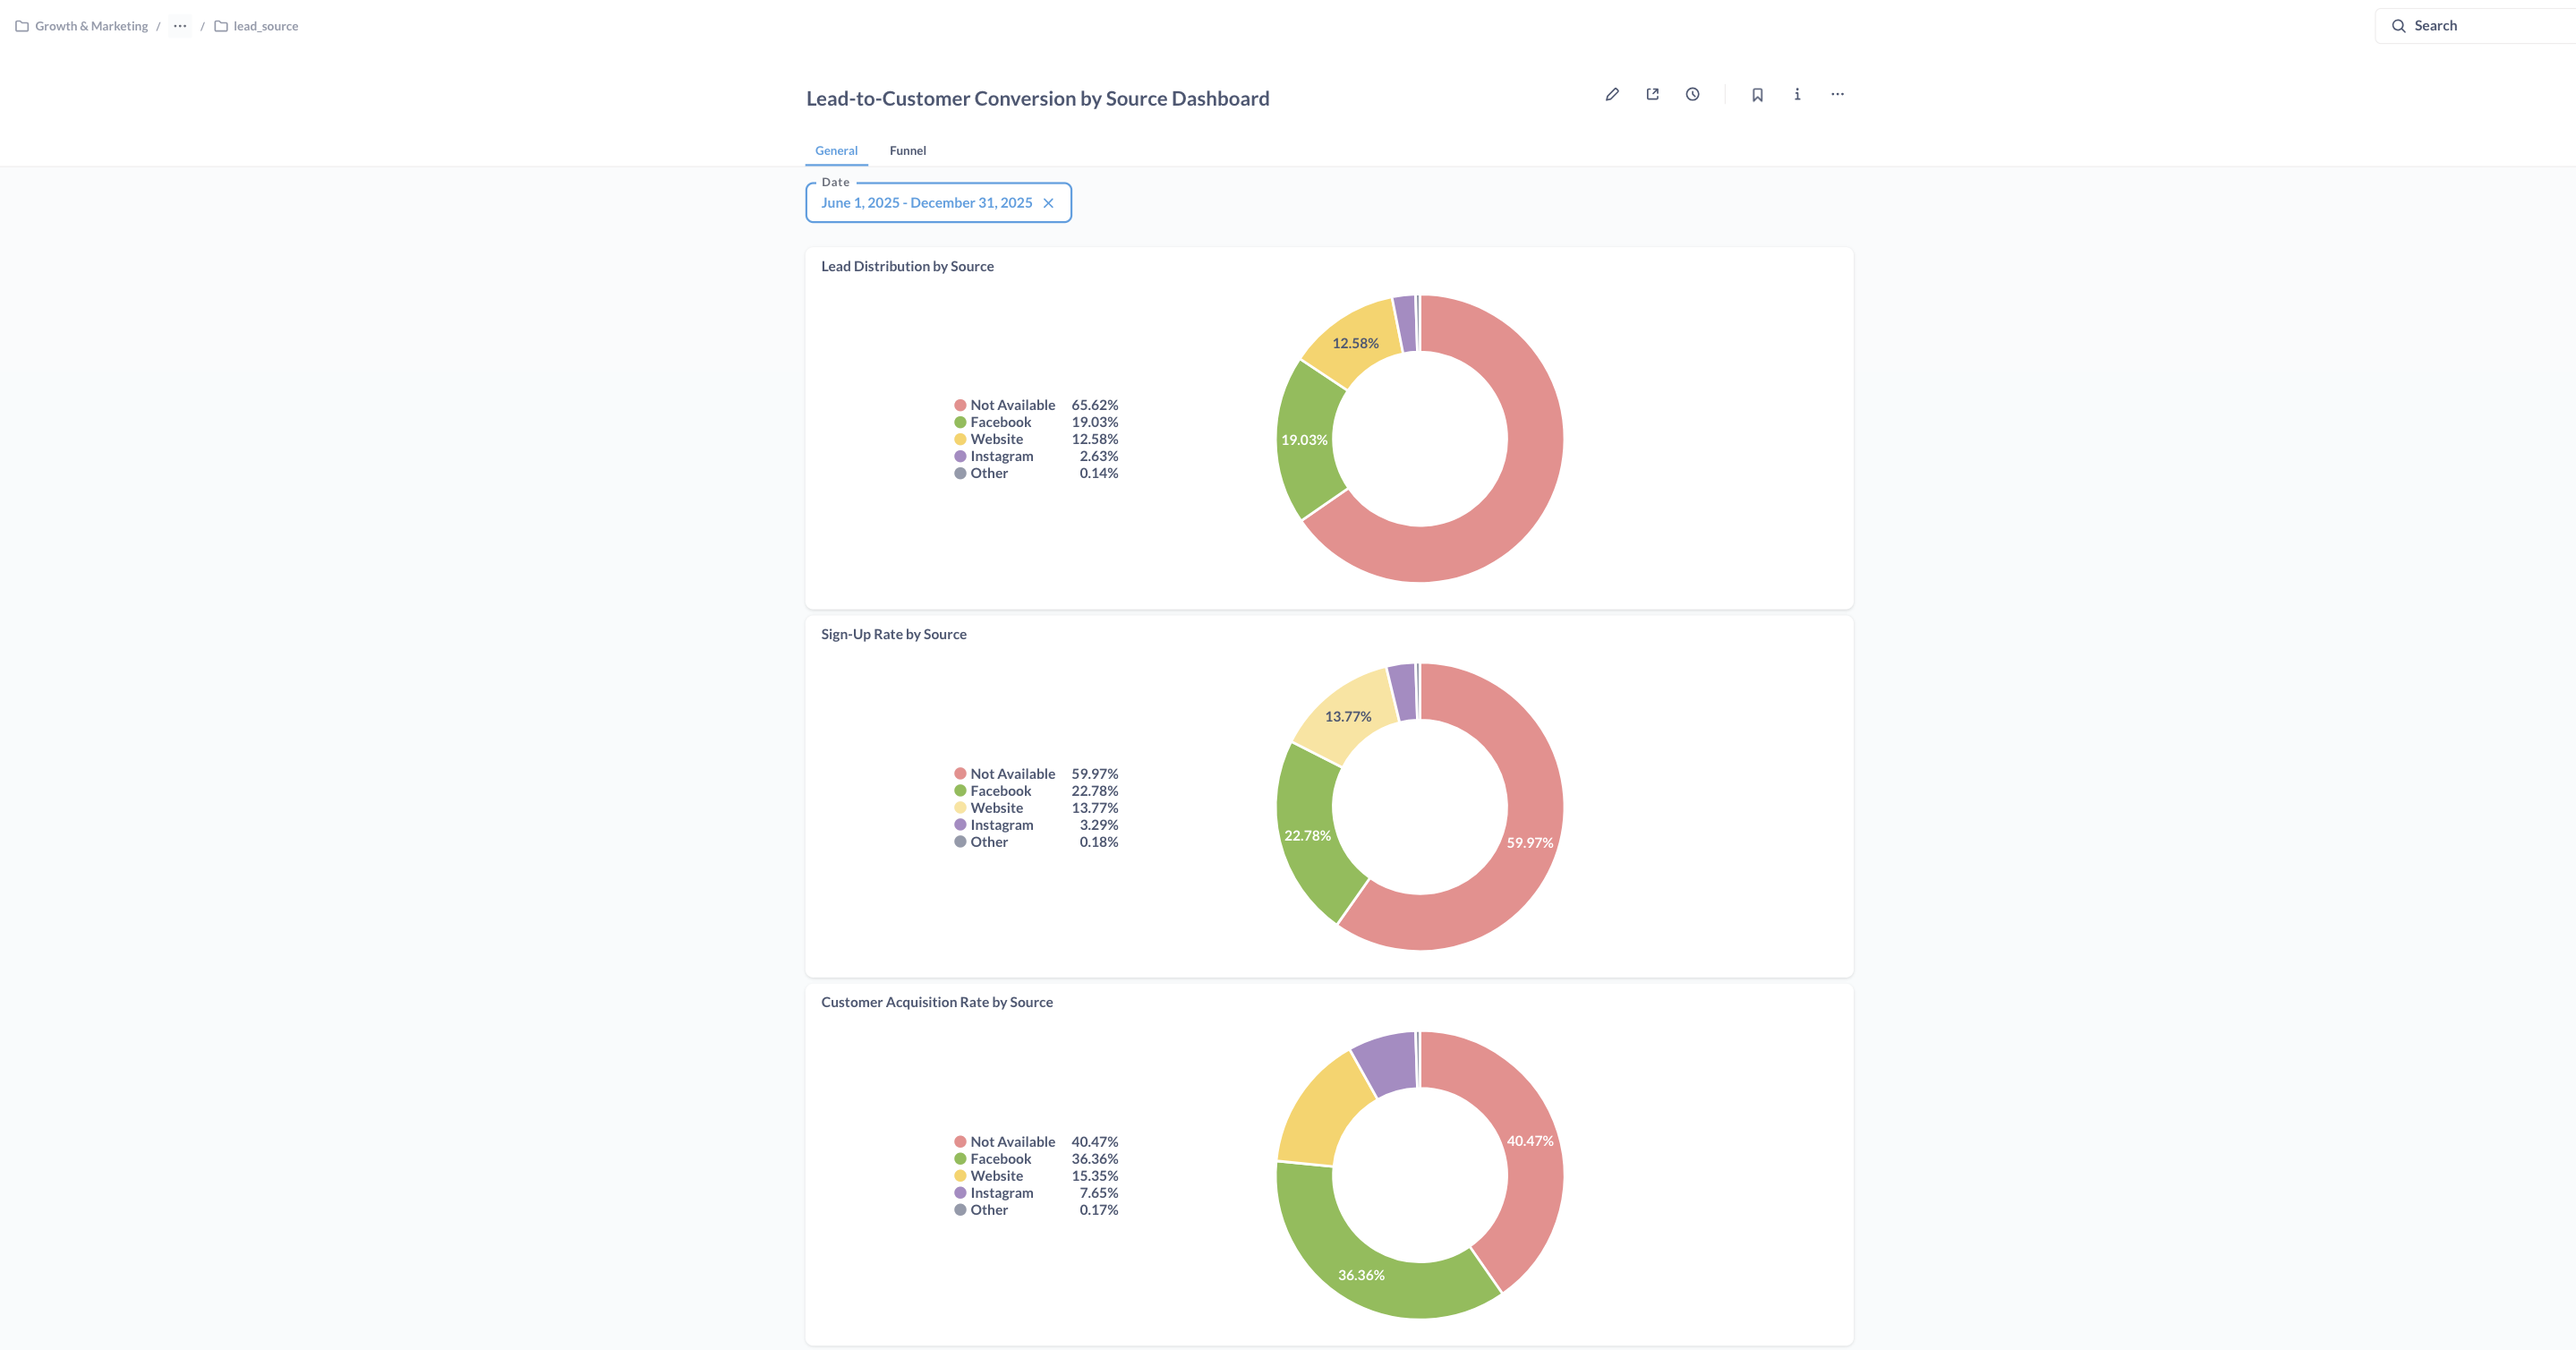
Made pricing visible in ad copy and landing pages before users clicked through. This deliberately filtered out users who assumed the product was free, a common misconception for SaaS tools in the Nigerian market. The clearest signal is in the channel efficiency data: Facebook generated 19% of leads but 36.36% of customer acquisitions, nearly 2x representation at the paying customer level.
In the Nigerian SaaS market, there is a strong user expectation that digital tools are free. Showing price upfront in ads reduces click volume but dramatically improves click quality. You pay for fewer people, but the ones who click already know what they are paying and have decided it is worth it. That is why a $3 CPA is possible on a $250 budget. It is not a trick. It is pre-qualification at the top of the funnel.
Channel efficiency: lead share vs customer share.
The most telling metric is the gap between what each channel contributes in leads versus what it contributes in paying customers. A channel punching above its lead share at the customer level is delivering high-quality, pre-qualified traffic.
- Facebook: 19% of leads, 36.36% of customers. 1.91x efficiency ratio. Nearly doubles its lead share at the customer level.
- Instagram: 2.63% of leads, 7.65% of customers. 2.91x efficiency ratio. Smallest channel, sharpest converter.
- Both paid channels convert to customers at nearly 2x (Facebook) and 3x (Instagram) their lead share
- Facebook lead-to-signup rate: 89-91%, well above organic’s 70-75%
- Instagram signup-to-customer rate hit 57.14% in October, the highest of any channel in any month
Full-funnel view: paid vs organic.
Facebook’s lead-to-signup rate consistently ran at 89-91%, well above organic’s 70-75%. This means Facebook leads were more likely to complete the sign-up form, another signal of pre-qualification quality.
Instagram’s signup-to-customer rate hit 57.14% in October, the highest of any channel in any month across the entire dataset. On a small budget, Instagram was converting more than half of its sign-ups into paying customers.
The August inflection point visible in organic data is also present in Facebook and Instagram data. This confirms that the new commercial-intent landing pages built for organic also served as the paid social destination, amplifying the conversion improvement across all channels simultaneously.
Benchmark context.
A $3 CPA for a paying B2B SaaS customer is an exceptional result by any standard. Typical B2B SaaS Facebook CPA ranges from $50 to $200+. Instagram runs $30 to $150+. To acquire the same 83 customers at even the low end of industry benchmarks ($50 CPA) would have required $4,150/month, 16x the actual spend.
The efficiency gap is entirely attributable to deliberate execution decisions, not luck or market conditions.
Seven months. Documented.